In this blog, I am going to show you my reflection of the lesson mentioned above.
This lesson is all about Imaging and Design for Online Environment, which shows how to get the hand of basic principles of graphics and layout, creating infographics, online file formats for images, and so on.


This lesson is all about Imaging and Design for Online Environment, which shows how to get the hand of basic principles of graphics and layout, creating infographics, online file formats for images, and so on.

sample of an infographic
The most visited site on earth is Google, as per alexa.com . Google was ranked number one on alexa.com, a website known for ranking web page popularity.
screenshot of the google home page from google.com.sa

alexa.com
What has also been discussed in this lesson are the basic principles of graphics and layout.
The Basic Principles of Graphics and Layout
- Balance. The visual weight of objects, texture, colours, and space is evenly distributed on the screen.

sample illustration of balance (https://blogger.googleusercontent.com/img/b/R29vZ2xl/AVvXsEijSFW8JZXmlEac9tb5LcIsA8MKzwOqU7-l_ygndiMb2l69-YcuDF7udCgxLv-ekNajZW09Eztg-iKmRHWdhscl1heYSvbMb1FyLXhDx31TPkHlduQUzTLCCo6gkKF3pKqmZA1i0BYoCj0/s1600/balance+in+graphic+design.jpg)
- Emphasis. An area in the design that may appear different in size, texture, shape, or color to attract the viewer's attention.

sample illustration of emphasis (http://static1.squarespace.com/static/5272f3e8e4b0804eedc16282/5272f79de4b0da349d7ff0c6/53f26dc9e4b0c307b92bc3c2/1408396764201//img.png)
- Movement. Visual elements that guide the viewer's eyes around the screen.

sample illustration of movement (https://blogger.googleusercontent.com/img/b/R29vZ2xl/AVvXsEijSFW8JZXmlEac9tb5LcIsA8MKzwOqU7-l_ygndiMb2l69-YcuDF7udCgxLv-ekNajZW09Eztg-iKmRHWdhscl1heYSvbMb1FyLXhDx31TPkHlduQUzTLCCo6gkKF3pKqmZA1i0BYoCj0/s1600/balance+in+graphic+design.jpg)
- Pattern, repetition, and rhythm. These are the repeating visual elements on an image or layout to create unity in the layout or image.
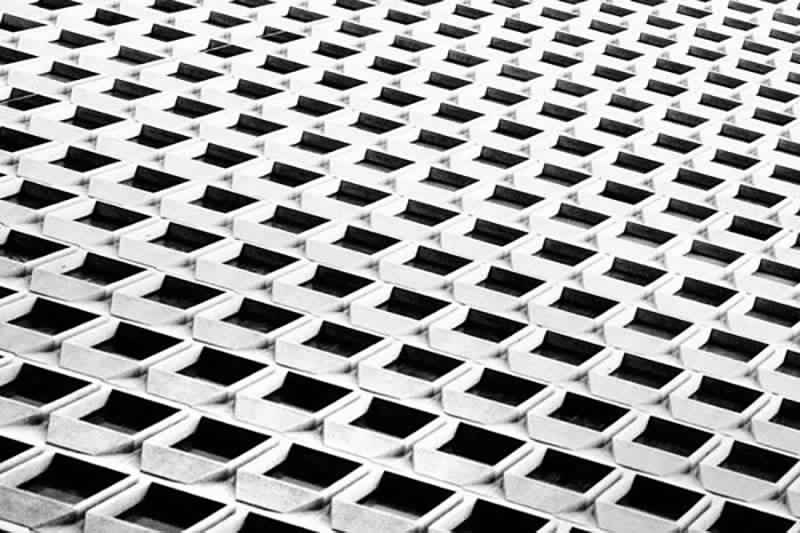
sample illustration of pattern, repetition, and rhythm (http://www.designorate.com/wp-content/uploads/2016/06/design-principles-01.jpg)
- Proportion. Visual elements create a sense of unity where they relate well with one another.

Proportion (http://char.txa.cornell.edu/language/principl/fish.gif)
- Variety. This uses several design elements to draw a viewer's attention.
Infographics
Also known as Information Graphics, these are used to represent information, statistical date, or knowledge in a graphical manner usually done in a creative way to attract the viewer's attention.
Infographics make complex data become more visually appealing to an average user.

Above shown is an example of an infographic, illustrating education around the world.
Information graphics can be made using the website called Piktochart (piktochart.com).
For further reference, please refer to pages 103-119 of Empowerment Technologies: Innovative Training Works, Inc. (ISBN 978-971-23-7830-0)
No comments:
Post a Comment